
We Take Green Seriously
The Port of Hueneme is at the cutting edge of decarbonization efforts of large industrial facilities. Hueneme is a Nationally recognized leader in many areas of seaport sustainability and more broadly for our progress in the following critical areas:
- Port decarbonization with focus on
- New clean sources of energy
- New infrastructure to deliver that energy
- New zero emission equipment moving cargo powered by clean energy
- Community air quality monitoring network
- Green Marine Certification
- Blue Whales Blue Skies
- Community Outreach
- Workforce Development
Committed to Environment
The Port of Hueneme is committed to protecting the environment and supporting a healthy quality of life for our community. The Port plays a valuable role in the health and viability of the local and regional economies and takes very seriously its role as an active community partner and as an environmental steward.
0:00
hi good afternoon president ramirez and
0:01
fellow board members i appreciate uh
0:04
having a little of your time this
0:05
afternoon to share with all of you
0:08
essentially the first seven months of
0:11
data
0:12
that is being collected at the wonderful
0:16
sorry i’m just pulling up the slideshow
0:17
as we speak um air monitors
0:20
that the board approved a little bit
0:21
more than a year ago about a year and a
0:23
half ago
0:24
um i will keep brief we are talking
0:27
about air quality so it gets really
0:29
technical and down in the weeds at times
0:31
but i’m going to attempt to float above
0:33
all that and give you guys really the
0:35
kind of
0:36
meat of the what we’re seeing and the
0:38
the sort of science we’re looking at
0:41
so as the commissioners will remember we
0:44
have
0:45
uh placed these monitors on the roof
0:48
at haycock’s elementary which is down on
0:50
perkins
0:51
many of you are familiar with that
0:53
location there
0:55
and uh is adjacent to uh
0:58
wineme road as our corridor there and
1:00
then
1:01
in a large residential area typical of
1:03
south oxnard
1:04
a little more than a mile to pretty much
1:07
due east
1:07
of the port this was selected because of
1:11
its
1:12
kind of representation of the broader
1:13
community and then the proximity
1:15
to the port we began monitoring back in
1:18
december of last year so in a few months
1:20
we will be coming up on a full year’s
1:22
worth of data
1:24
now what does this stuff look like well
1:26
you you will remember
1:27
when we had the the sort of unveiling
1:29
ceremony
1:30
uh we had some of the equipment out on
1:32
the table for the community to see
1:34
this is what it physically looks like in
1:36
location on the roof there
1:38
we purposefully uh positioned it in a
1:41
place where it would be
1:43
and um less visible from from the road
1:45
there
1:46
and what we’re actually monitoring for
1:48
is essentially two things we’re
1:50
measuring for
1:51
tiny tiny air particles called
1:53
particulate matter
1:54
of different sizes and then we’re also
1:57
measuring stuff around kind of what the
1:59
atmosphere is doing what is the
2:01
temperature
2:02
what is the wind what is the direction
2:03
the wind is coming from
2:05
so you can see the the the one on the
2:07
right that looks sort of like a mini
2:09
fridge
2:10
that is the enclosure that contains the
2:12
the expensive
2:13
high accuracy monitors and then the the
2:16
tp
2:17
or excuse me tree looking thing on the
2:19
left is our sort of
2:22
atmospheric measurements and the little
2:24
small mobile monitors
2:26
so those two work together to give us
2:28
our information
2:30
so you will remember from that unveiling
2:32
this piece of equipment was available
2:34
for the public to see and sort of look
2:37
at and ask questions about
2:38
this is our reference grade
2:41
particulate monitor and the reason that
2:44
reference grade piece is important
2:46
is because there’s a full range of air
2:49
monitoring equipment
2:50
from the inexpensive small mobile types
2:54
of monitors
2:55
all the way up to the other end of the
2:57
spectrum which is this monitor
2:59
and so this monitor gives us information
3:02
data around the air quality that is the
3:05
same
3:06
quality as that which a group like the
3:09
environmental protection agency
3:11
the air resources board the air district
3:14
would use the same type of data so it is
3:16
the very highest quality
3:18
data available so it is really kind of
3:20
the standard if if
3:22
one were to ask what is air quality like
3:24
in ventura county
3:26
a monitor like this would be where they
3:27
would get their answer so this piece of
3:30
machinery here is measuring
3:31
three different sizes of that
3:33
particulate matter
3:34
including humidity and humidity is
3:37
really important because of course
3:39
humidity is just a measurement of
3:40
moisture in the air but
3:42
those moisture pieces those little bits
3:44
of water right
3:46
are are acting like little sponges so
3:48
they’re grabbing pieces of dust or other
3:50
particulate out of the atmosphere all
3:52
the time
3:53
so the more water you have the more
3:55
difficult it can be to get a really
3:57
accurate measurement
3:58
so that’s an important measurement there
4:00
the other one
4:02
that’s similarly uh accurate
4:05
and of high quality is this one called
4:08
an athlometer
4:09
kind of a fancy word for saying that
4:11
this is a machine that does nothing
4:14
but measure very very tiny particles
4:17
called black carbon and the reason that
4:20
we’re doing that is important because
4:23
communities environmental justice
4:26
public health advocates etc have become
4:29
very very
4:30
focused in on something called diesel
4:32
particulate matter
4:34
and diesel particulate matter is
4:35
essentially
4:37
a combination of byproducts that are
4:40
left over
4:41
from the combustion of diesel fuels and
4:44
it’s diesel it’s fuels that are similar
4:46
to diesel so gasolines and distillates
4:49
and
4:50
bunker fuel and a whole bunch of stuff
4:52
they put out a
4:53
kind of a variety of of air pollution
4:57
that includes gases and particles and
5:00
diesel particulate matter
5:01
in and of itself is very very difficult
5:04
to monitor for
5:06
because of that sort of mix of all the
5:07
different things in it
5:09
so black carbon is the surrogate that is
5:12
used
5:12
in place of diesel particulate matter so
5:15
we test for black carbon to
5:17
understand what the diesel particulate
5:19
matter that’s out there would actually
5:21
look like
5:22
and this is widely done and this is a
5:24
means of understanding what that dpm
5:27
which is the acronym for diesel
5:28
particulate matter looks like
5:30
and then the other really important
5:32
piece to this is that black carbon
5:34
doesn’t just come
5:35
from burning diesel fuel it also comes
5:38
from burning
5:39
other organic substances wood
5:42
in particular so anytime people are
5:45
having a fire at home in their fireplace
5:48
anytime there is a brush fire or forest
5:51
fire
5:52
this machine can allow us to
5:54
differentiate between which
5:56
is which when is it brush fire smoke
5:59
and when is it diesel smoke so that’s a
6:01
really important thing we’ll talk about
6:03
a little bit more
6:05
we put up a series of these little small
6:07
handheld meters
6:08
um these are less accurate of course uh
6:11
and what we’re trying to do with these
6:13
is create a relationship between the
6:15
little ones
6:16
and the big fancy one so that we can be
6:19
able to use these little ones
6:20
in other locations take them down put
6:23
them at the port
6:24
you know put them at a community
6:25
location and understand what the
6:28
readings should actually look like based
6:29
on that
6:31
so what particular matter why black
6:34
carbon
6:35
well of course so particulate matter 10
6:37
that’s the biggest number it’s the
6:39
biggest size
6:40
it’s things like dust right if you were
6:43
to be walking on a dirt field the dust
6:45
that would get kicked up
6:46
that is pm10 that would get stuck in
6:48
your nose stuck in your mouth
6:50
pm 2.5 much smaller four times smaller
6:54
that stuff is goes through your mouth
6:57
and through down into your lungs
6:59
and can get into your basically into
7:01
your lungs
7:02
pm1 which is again half as small
7:06
and more than 2.5 these are tiny tiny
7:09
particles
7:10
and these can go into the bloodstream
7:13
and can
7:13
travel all around the body and can get
7:16
into
7:17
different organs and cause different
7:18
negative health outcomes
7:20
so that’s why that that fine grain stuff
7:22
that that really small particle stuff is
7:24
really
7:25
getting a tremendous amount of attention
7:27
from the state in particular the
7:29
california air resources board is
7:31
very focused on uh on pm and dpm right
7:34
now
7:35
so where does this stuff come from where
7:37
does the black carbon that we’re
7:38
measuring
7:39
the diesel particulate matter that we’re
7:41
measuring where is this coming from
7:43
well it comes from a couple different
7:45
sources on-road stuff so all the trucks
7:48
buses cars trash trucks vans
7:51
everything out there off-road stuff so
7:55
our ocean-going vessels the ships
7:57
construction equipment
7:59
cargo handling equipment trains um
8:02
agricultural equipment whether it’s a
8:04
tractor or groundwater pump
8:06
but then again of course we’ve got that
8:08
other piece that is that
8:09
biomass that is that plants you know
8:13
wood that people are burning and those
8:15
wildfire pieces
8:16
so that’s that sort of mix of
8:18
combination of stuff typically
8:20
that sort of brush fiery wood stove
8:23
stuff is less than 20 percent but that
8:25
can change
8:26
and and we’ll see that so wildfire
8:30
wildfire as you guys know is one of
8:33
the most visible signs of our changing
8:36
climate
8:37
and is one of the most readily um
8:40
obvious sort of sources of bad air
8:43
quality
8:44
we all know we’ve all seen and breathed
8:46
in the last two months
8:48
smoke from fires that can be hundreds of
8:51
miles away from us
8:53
you know sort of lending to this how
8:55
fluid air
8:56
is air moves all over the globe
8:59
that smoke that came from california
9:01
wildfires is being measured
9:03
in europe parts of asia now it
9:05
circumnavigates the entire world
9:08
so why is wood smoke bad why do we care
9:10
about this well because
9:12
when there are wildfires nearby those
9:16
average concentrations can increase by
9:19
20 times or more those really
9:22
high high peak levels can go up by more
9:25
than a hundred times from wood smoke
9:28
so it’s very important to us that we
9:30
understand
9:32
when there is wood smoke where is it
9:34
coming from
9:35
is it wood smoke those sorts of
9:36
questions because what we’re trying to
9:38
do is help to understand
9:40
when there’s bad air quality in the
9:42
oxnard plane
9:44
where is that pollution coming from
9:47
so let’s cut to the chase what are we
9:49
talking about what are the numbers
9:50
here we have our first seven months of
9:53
data
9:54
december through august and this is
9:56
black carbon again
9:58
and the units that we’re talking about
10:00
here are
10:02
of course um micrograms so that is a
10:06
thousandth of one gram
10:09
if you were to take that and put it into
10:11
a big box a meter cube
10:14
if you were to drop a thousandth of a
10:16
gram into that box
10:18
of air that would be a microgram so what
10:20
we’re seeing
10:22
is january december february those cold
10:25
weather months
10:26
are our worst air quality months
10:29
and then our numbers have gotten
10:31
sequentially better all the way until
10:33
august and then in august because of the
10:36
fires
10:36
those numbers went back up again and
10:39
we’ll get into some more detail as to
10:40
why this is but this generally is
10:42
showing us
10:43
that air quality is very good and it’s
10:46
very consistent and that’s really
10:48
important that consistency is important
10:51
because
10:52
bad health outcomes come from long-term
10:56
exposure
10:56
to bad air so if we have long-term
10:59
consistent numbers showing good
11:01
air we can say that overall
11:04
air quality in the oxnard area is very
11:06
very good
11:08
so this is just another diagram showing
11:10
you those first three months december
11:12
january february see how that bar is
11:15
almost twice as high
11:16
as all the subsequent months so that’s
11:20
showing
11:20
we have bad air when it’s cold and
11:23
better air as it starts to warm up
11:26
why is that giles did you go back to
11:29
that slide before
11:32
if yeah if i was going to try to shoot
11:34
bullet holes in it
11:35
i would go well in march we got shut
11:38
down
11:38
you know with kobet everybody stayed off
11:40
the road so how does that impact this
11:42
data
11:43
absolutely that’s a great question
11:44
commissioner rooney i appreciate that
11:46
i will show you the answer to your
11:47
question in just a second because we
11:49
actually have the data
11:51
showing when there are ships present and
11:52
when there are not ships present
11:54
and showing our numbers of ships from
11:57
last year as a comparison against this
11:59
year
12:00
so let me just jump into that in just
12:02
one moment i just wanted to display kind
12:04
of the why this stuff is bad in the
12:06
winter
12:07
and the reason it is bad in the winter
12:09
is really because of atmospheric science
12:12
wonderful complexities of
12:15
air and temperature right when air gets
12:17
hot it gets bigger it’s why a hot air
12:19
balloon rises up
12:20
or when you have a fireplace and all the
12:22
heat goes up to the ceiling
12:24
that cold dense air sinks to the ground
12:27
to the bottom
12:28
so in the winter everywhere oxnard
12:31
ohio etc we get a very cold
12:34
layer of air that gets squashed by a
12:37
very
12:38
thin layer of warm air with heavy cold
12:41
air sitting on top of it it’s kind of
12:42
like a cake
12:44
and so the same amount of pollution is
12:46
getting made all the time
12:48
that source the source of pollution the
12:50
cars the buses
12:51
they’re all just driving doing their
12:53
thing but the amount of
12:55
air in which all that pollution is
12:58
sitting
12:59
gets squashed in those cold months by
13:01
more than half
13:03
so you have half as much space for the
13:06
same amount of pollution
13:07
so it gets twice as bad that’s really
13:10
what’s driving that
13:11
so we’re going to do a quick comparison
13:13
against la long beach
13:15
and winemi the purple line you can see
13:18
here that’s
13:18
la long beach numbers the lower darker
13:21
line
13:22
that’s our haycox monitor so the message
13:25
here
13:25
is that we’re basically the air quality
13:27
is about twice as good
13:29
consistently across same thing here this
13:32
is
13:33
without any fire data included there so
13:35
same thing about twice as good as those
13:37
la numbers
13:38
so now commissioner rooney to answer
13:40
your question
13:42
how do we know it’s not a covid related
13:44
artifact that we see these decreases
13:46
here is december we’re going to look at
13:48
ships and port and no ships in port what
13:50
we’re looking at here is
13:51
each of these dots is a one hour
13:54
average each image left and right
13:58
has 720 dots on it
14:01
if you see blue blue means good air
14:04
if you see red red means bad air and
14:07
where the dot
14:08
is on the map tells you
14:11
where that wind was blowing to blow that
14:15
that air into the monitor so as you can
14:18
see
14:20
the bad air that we see in december
14:23
when there’s ships at the dock is coming
14:25
from the north
14:27
it’s not coming from the west where the
14:29
port is located
14:30
when there’s no ships you see the same
14:32
thing you see
14:34
bad air coming from the north and from
14:36
the northeast a little bit as well
14:38
but predominantly even in the bad air
14:41
times
14:42
you see good air lots and lots and lots
14:45
of good readings
14:47
same thing in january chips no ships
14:50
same thing same thing in february
14:53
another cold month
14:55
lots of clean dots in the center these
14:57
bad
14:58
dots if we want to call them that these
15:00
are all taking place
15:02
at two and three in the morning when the
15:05
air is the very coldest
15:06
when that layer of air is squished to
15:09
its very thinnest
15:10
if you want to breathe the worst air in
15:14
the entire year go outside at three in
15:17
the morning
15:18
three in the morning on christmas
15:19
morning santa claus gets it because
15:23
everybody’s having a fire and
15:25
everybody’s you know got their
15:26
fireplaces going
15:27
and that mo that cold air again
15:29
squishing
15:30
february we see it march same thing now
15:33
march is interesting
15:34
because as you guys know having been
15:36
around the port for a long time in the
15:38
spring
15:38
that air that wind starts to shift from
15:41
being gentle
15:42
to blowing out of the west so see this
15:45
little
15:46
clump of what looks like feathers right
15:47
in the middle
15:49
that’s a like a wind rose that’s showing
15:51
us wind direction
15:53
and the more colorful and the longer
15:55
they kind of look like turkey feathers
15:57
the longer they are that means the more
15:59
wind so here we start to see
16:01
look at that this is april we see long
16:03
turkey feathers from the west
16:05
that means air blowing in from the west
16:08
again
16:09
lots and lots of good air a little bit
16:12
from the west but those readings again
16:13
were
16:14
very late at night that’s essentially
16:17
the story here
16:19
is really that air in oxnard is really
16:22
really fluid
16:24
um it’s really about
16:27
consistent numbers good quality air
16:31
numbers that we’re seeing there
16:32
there’s lots more data i could show we
16:34
can really sink our teeth into this if
16:36
you guys are interested
16:37
but i wanted to give you kind of that
16:38
high level and the the takeaways are
16:41
essentially that we have consistently
16:43
very good quality air the worst air that
16:46
anybody breathes in oxnard is really
16:50
being driven by long-term seasonal
16:53
changes
16:54
in the temperature and wind regime for
16:56
the area
16:58
that there isn’t a distinct signature
17:01
of port pollution discernible in this
17:04
monitoring data
17:06
and that’s important because it says
17:08
that as we had hoped
17:11
air quality is consistent it’s fluid and
17:14
it’s good quality
Environmental Steward
Implementing green initiatives is the way we do business at the Port of Hueneme. In partnerships with our customers, the Port strives to minimize the environmental impacts associated with trade operations on the local community.
- Full compliance with federal, state and local regulations, and implementation of pollution prevention measures
- The Environmental Framework is an action plan for the Port to execute on and track its environmental stewardship programs
Green Initiatives
- The Port, and every port tenant, is proactive about reducing emissions by partnering in planning for a transition to zero emission equipment on Port and in currently using cleaner burning fuels in the vessels and equipment used to move cargo
- Clean energy is essential at the Port and includes using clean electrical power for cargo handling equipment like cranes and forklifts as well as ships at berth and light duty vehicles
- Replacing conventional diesel with renewable R99 diesel for Port harborcraft, and electrifying cargo handling equipment to reduce emissions
- The Port monitors water quality to understand local water quality in the harbor and local ocean
- In 2017, the Port prepared its first annual Air Emissions Inventory (EI) to quantify the air quality impacts associated with maritime operations and has continued to do so annually

What's New at the Port
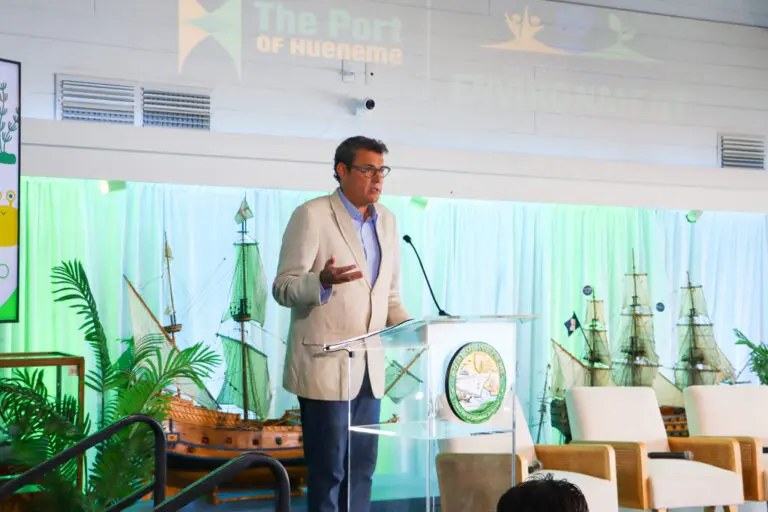
Making Waves: Port of Hueneme Hosts “Sustaining the Seas Summit” in Recognition of World Oceans Day
Ocean experts, policymakers, and community leaders dive into the challenges facing our oceans and explore innovative solutions to protect California’s waters

Port of Hueneme Hosts Regional Dive Teams for Advanced Maritime Search-and-Rescue Training
Four-day ANTX-Coastal Trident exercise unites regional dive teams to train, test emerging technologies, and strengthen mutual-aid response.
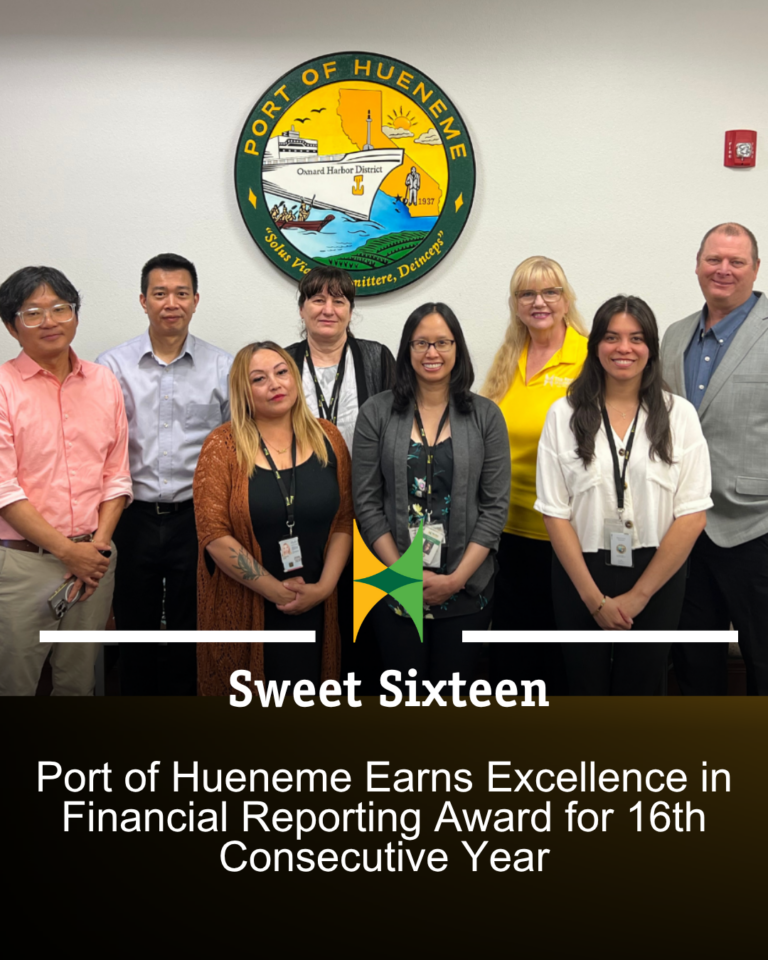
Sweet Sixteen: Port of Hueneme Earns Prestigious Excellence in Financial Reporting Award for Sixteenth Straight Year
The Government Finance Officers Association of the United States and Canada (GFOA) has awarded the Certificate of Achievement for Excellence in Financial Reporting to the Oxnard Harbor District – Port of Hueneme for the sixteenth consecutive year. This year’s award, which recognizes the strength of the Port’s comprehensive financial report for the fiscal year that ended on June 30, 2025, is the highest form of recognition teams can achieve in governmental accounting and financial reporting.